Letter from the CEO & 2021 Outcomes Report
Bloom Institute of Technology
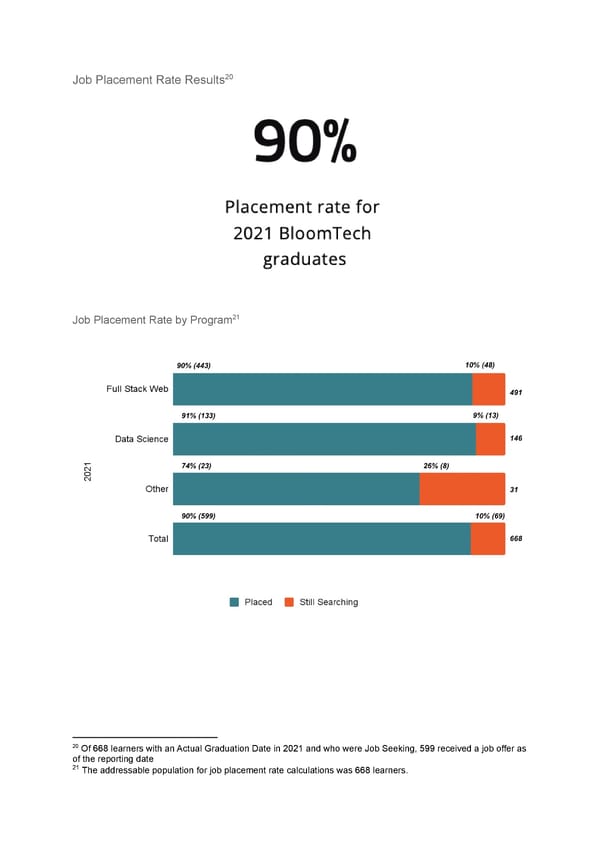
Letter from the CEO BloomTech was founded on the principle of opportunity. We saw that too many people didn’t have the chance to pursue their full potential, and we have worked ever since to break down barriers between learners and well-paying careers in tech. We are proud to share the outcomes we have achieved—and this is just the beginning. In line with our ongoing commitment to transparency, we again partnered with the advisory, tax, and assurance firm Baker Tilly US, LLP (formerly Moody, Famiglietti & Andronico, LLP). The firm independently examined the management’s assertions that you’ll read in the 1 BloomTech 2021 Outcomes Report. Our biggest takeaway: A full 90% of our 2021 graduates have landed jobs, which is the highest rate in our company’s history. This kind of success does not happen by accident. We have painstakingly built an industry-leading curriculum designed to teach the skills employers want. We support learners and graduates in the job hunt, beginning as soon as they join BloomTech and continuing until they secure a great job. And our dedicated team continually works to fine-tune our programs so that graduates of all backgrounds finish ready to work—and poised to transform their lives. Data are critical to communicating this progress. These numbers represent enormous change for real people—people like Aaron Burns. “Just like a lot of Americans, I was living paycheck to paycheck,” Aaron remembers. With a family to provide for, he was searching for a way to build a better life. That’s when he heard about BloomTech. He joined with one of BloomTech’s no-upfront-tuition options. In the Full Stack Web Development program, he built up the skills and confidence needed to transition to a career in tech. Aaron says, “It gave me experience. It made me ready for technical interviews. It also just made me feel like a real software engineer.” Now heis a real software engineer, making more money than he did while selling everything from vacuum cleaners to cell phones in his previous jobs. “That consistent income will help me provide the stability and the consistency I was struggling to provide for my children,” Aaron says. “I just want to be able to give my kids the world.” Aaron’s story is just one among hundreds of transformations coming out of BloomTech in 2021. This report shares data that show tech jobs can provide a higher salary, better earning potential, and more flexibility. Our unflagging dedication to improving BloomTech led to huge gains in further streamlining our direct path to a tech career. As a result, more of our graduates are working in well-paying jobs, improving their lives, and contributing to the country’s economic recovery. -Austen Allred, BloomTech CEO & Cofounder November 02, 2022 1 Of 668 learners with an Actual Graduation Date in 2021 and who were Job Seeking, 599 received a job offer as of the reporting date: August 11, 2022
How BloomTech Works Our mission is as straightforward as it is impactful: We aim to provide a direct, low-risk path to a higher income. This mission serves individuals wanting to build a better future as well as employers looking for highly qualified workers. By training learners in what employers most need, we equip graduates to thrive in a changing market and enable companies to grow in an increasingly competitive economy. This is how we deliver on our mission. Flexibility Flexibility has always been fundamental to the BloomTech model. BloomTech was founded to be fully online so that a person’s opportunity was not limited to where they lived. Our remote school enables motivated learners anywhere to gain the skills needed to work for industry-leading companies. We strive to make BloomTech even more flexible to fit the lives of even more learners. For example, in 2022 we launched CareerFlow—a new, even more flexible learning experience that draws on changes that began in 2021. Now people anywhere can learn part-time or full-time, on a custom schedule that adapts to their lives, in a way that adjusts to their needs and strengths. By continuing to build a more flexible tech education experience, we’re opening the door to the tech industry for more people than ever before. Curriculum Through market surveys, conversations with employers, partnerships with hiring companies, discussions with BloomTech alumni working in the field, and more, we gain a clear understanding of what companies need from entry- and mid-level technical employees. Then, we reverse engineer our programs to meet these needs. Our courses teach the knowledge needed and provide hands-on experience so learners graduate with the skills employers are looking for. We also adjust curriculum as needed to reflect the most up-to-date and in-demand skills, platforms, and tools of the industry.
In 2021, we learned that employers were looking for workers with even deeper technical abilities. To update our curriculum, we: ● Added preparation and minimum score requirements for the General Coding Assessment, a commonly used standardized coding test ● Launched Applied Computer Science, an in-depth and hands-on portion of the curriculum in all core courses that teaches more advanced programming languages, algorithms, and data structures ● Incorporated auto-grading of assignments to objectively assess the quality, efficiency, and effectiveness of learners’ code We also launched our Backend Development course, developed in partnership with Amazon and modeled on their internal Amazon Technical Academy program, to help meet talent pipeline needs of Amazon and other growing companies. While our Backend Development learners did not begin graduating until 2022, this new course is yet another example of how we continually adapt to employers’ needs—and empower individuals to launch new careers. Career Support Similarly to how we design our curriculum, we reverse-engineer our career support to maximize learners’ opportunities, based on close partnerships with employers, market research, and analysis of graduates’ outcomes. Again, this is an ongoing effort to optimize how we get our learners from their starting point to a great tech career, no matter their background. In 2021, we expanded our career support. We incorporated job search support earlier in our programs, through personalized coaching as well as proprietary tools. Our career support helps learners and graduates: ● create effective and impactful resumes, LinkedIn profiles, and GitHub profiles ● stay organized in their job hunt and find the right openings to apply for ● be considered for openings from BloomTech Hiring Partners ● improve their performance in behavioral and technical interviews ● craft outreach emails using our messaging tools, then send that message to the right decision-makers in the hiring process ● negotiate job offers ● and more We continue to improve our career support. For example, starting in 2022 learners can get personalized career coaching, attend networking events, and gain technical skills during our Risk-Free Trial, even before they’ve made any financial commitments.
Definition of Success Our commitment to learner success is the foundation of the entire BloomTech model. The company was founded on aligned incentives, meaning we succeed when our learners succeed. We have stayed true to that essential vision. In late 2021, we introduced our 110% Tuition Refund Guarantee. Here’s what the 110% Tuition Refund Guarantee means: We’re so confident that graduates will get a job if they follow our program that we’re willing to not only refund their tuition but also pay them if they don’t find 2 that well-paying job after a year of searching . By aligning our company’s success to the success of our learners, everyone benefits. Individuals launch rewarding tech careers; employers gain motivated and skilled workers; and BloomTech grows, enabling even more people to achieve upward mobility. 2 Terms apply. All tuition types are not eligible for Tuition Refund Guarantee. Graduates must fulfill weekly career commitments in order to qualify.
Methodology & Definitions 3 In our last Outcomes Report , we included seven metrics important to understand BloomTech: 4 5 ● Graduation rate: Of the Starting Learners whose Original Expected Graduation Date 6 is in 2021, what percentage of them actually graduated as of the Reporting Date ? 7 ● Job placement rate: Of the learners whose Actual Graduation Date was during 2021, 8 and are job seeking , what percent of them have been placed as of the Reporting Date? 9 ● Time to placement: Of the Placed learners , how many of them were placed within X days of graduation? ● Salary outcomes: What is the median annualized salary of Placed Learners? ● Position type: What types of positions are BloomTech’s Placed Learners working in? ● Job title: What are the job titles of Placed Learners? ● Top hiring locations: Where do BloomTech Placed Learners receive job offers? In data sets where it is relevant, we break down outcomes according to program (Full Stack 10 Web Development, Data Science, and Other ) and/or program type (Full-Time and Part-Time). This year, we are also including: 11 Median salary growth : Difference between median annualized salary of first recorded offer after graduation from BloomTech and median annualized salary prior to joining BloomTech and secured a placement 3 BloomTech’s 2020 Outcomes Report covered learners who were scheduled to complete or graduated from a BloomTech program between January 1, 2020, and December 31, 2020 4 A Starting Learner is a learner who attended Day 1 of Unit 2 of the coursework 5 The date a learner is expected to graduate the program if they avoided repeating a unit or going on a hiatus; Unit is a combination of 4 sprints where each sprint is 1 week long course 6 Reporting Date: August 11, 2022 7 BloomTech defines a learner as a student or alumnus of a BloomTech program 8 A learner is considered Job Seeking if they are actively working with a Career Coach, are actively searching for a job using BloomTech Outcomes products, and/or have communicated to the Outcomes team that they are actively applying or searching for a job in a technical field. 9 A learner whose Actual Graduation Date was in 2021 and who was subsequently placed in a job as of the Reporting Date 10 UX, iOS, and Android 11 Salary comparison of salary earned prior to joining BloomTech vs post-BloomTech first placement salary of learners who reported previous salary prior to attending BloomTech and got placed; Actual population for Median Annualized salary growth data is 527, 88% of the total addressable population
BloomTech 2021 Outcomes Report This report covers learners who were scheduled to complete or graduated from a BloomTech program between January 1, 2021, and December 31, 2021
Baker Tilly US, LLP 1 Highwood Drive Tewksbury, MA 01876 United States of America T: +1 (978) 557 5300 bakertilly.com Independent Accountants’ Report To the Management of BloomTech, Inc. We have examined management of BloomTech Inc.’s assertions that the accompanying BloomTech, Inc.’s 2021 Outcomes Report (the Report) for the period from January 1, 2021, through December 31, 2021, is presented in accordance with the criteria set forth in the Management Statement Regarding Assertions Related to Bloomtech’s Program Results. BloomTech Inc.’s management is responsible for its assertions. Our responsibility is to express an opinion on management’s assertions based on our examination. Our examination was conducted in accordance with attestation standards established by the American Institute of Certified Public Accountants. Those standards require that we plan and perform the examination to obtain reasonable assurance about whether management’s assertions are fairly stated, in all material respects. An examination involves performing procedures to obtain evidence about management’s assertions. The nature, timing, and extent of the procedures selected depends on our judgment, including an assessment of the risks of material misstatements of management’s assertions, whether due to fraud or error. We believe that the evidence we obtained is sufficient and appropriate to provide reasonable basis for our opinion. We are required to be independent and to meet our ethical responsibilities in accordance with relevant ethical requirements relating to the engagement. In our opinion, management’s assertions that the accompanying Report for the period from January 1, 2021, through December 31, 2021, is presented in accordance with the criteria set forth in the Management Statement Regarding Assertions Related to BloomTech Inc.’s Program Results, is fairly stated, in all material respects. Baker Tilly US, LLP Tewksbury, Massachusetts November 2, 2022 Baker Tilly US, LLP, trading as Baker Tilly, is a member of the global network of Baker Tilly International Ltd., the members of which are separate and independent legal entities. © 2021 Baker Tilly US, LLP
Management statement regarding assertions related to BloomTech’s program results We, as management of BloomTech, are responsible for the assertions made in preparing the BloomTech 2021 Outcomes Report (the Report) for learners who had an Original Expected Graduation Date, and/or learners who actually graduated in the period from January 1, 2021, through December 31, 2021. Management’s assertions are included within the results of the Report and are based on the criteria as defined. The Report is intended to provide readers with information about historical graduation and job placement statistics for the period from January 1, 2021, through December 31, 2021. We confirm, to the best of our knowledge and belief, the following assertions:
12 Graduation Rate There are various reasons learners do not graduate at their expected graduation date (including lingering effects of the COVID-19 pandemic). Our model enables learners to take longer than originally planned or take a hiatus, and some are still working toward completing their program. We believe more rigorous academic requirements may have lowered graduation rates in the short term as learners adjusted to the higher technical bar. While we are working to raise graduation rates for all learners, we also recognize that the curriculum changes led to better preparing graduates for the job market—and therefore 2021 graduates’ higher-than-ever 13 placement rates . We are committed to giving all our learners the strongest chance possible of completing BloomTech and landing a well-paying tech job after graduation. We continue to work on raising graduation rates while maintaining high standards, so our alumni graduate ready to work and contribute to their new jobs. Graduation Rate Addressable Population The addressable population for the Graduation Rate is the 1,698 Starting Learners whose Original Expected Graduation Date was in 2021, the period from January 1, 2021, to December 31, 2021, regardless of when these learners actually graduated. This population of 1,698 learners is comprised of 3 categories: ● Those who withdrew from BloomTech ● Those who are still enrolled at BloomTech, as of the Reporting Date 14 ● Those who graduated from BloomTech We designed the BloomTech model to accommodate multiple pathways to graduation, rather than taking a “one-size-fits-all” approach. That means the program length can vary from one learner to the next. There are several factors that can result in a learner’s Actual Graduation 15 Date being later than their Original Expected Graduation Date, such as repeating a unit, going on hiatus for personal reasons, or switching from a full-time to a part-time program. We have purposefully designed our model to allow for this type of flexibility because we understand that each learner comes from unique circumstances and has different needs over the course of their educational experience. 12 Management’s criterion for defining Graduation Rate is determined from the population of Starting Learners whose Original Expected Graduation Date is in 2021 and actually graduated as of the Reporting Date Reporting Date: August 11, 2022 Starting Learner: A learner who attended day 1 of Unit 2 of the coursework Original Expected Graduation Date: The date a learner is expected to graduate the program if they avoided repeating a unit or going on a hiatus; Unit is a combination of 4 sprints where each sprint is 1 week long course 13 Of 668 learners with an Actual Graduation Date in 2021 and who were Job Seeking, 599 (90%) received a job offer as of the reporting date 14 Includes learners who accepted a technical position prior to completion of their program 15 The date when a learner successfully completes the final sprint of their program
16 Graduation Rate Results Graduation Rate by Program Graduation Rate by Program Type 16 The addressable population for graduation rate calculations was 1,698 learners. Due to rounding, totals may not add up to 100%.
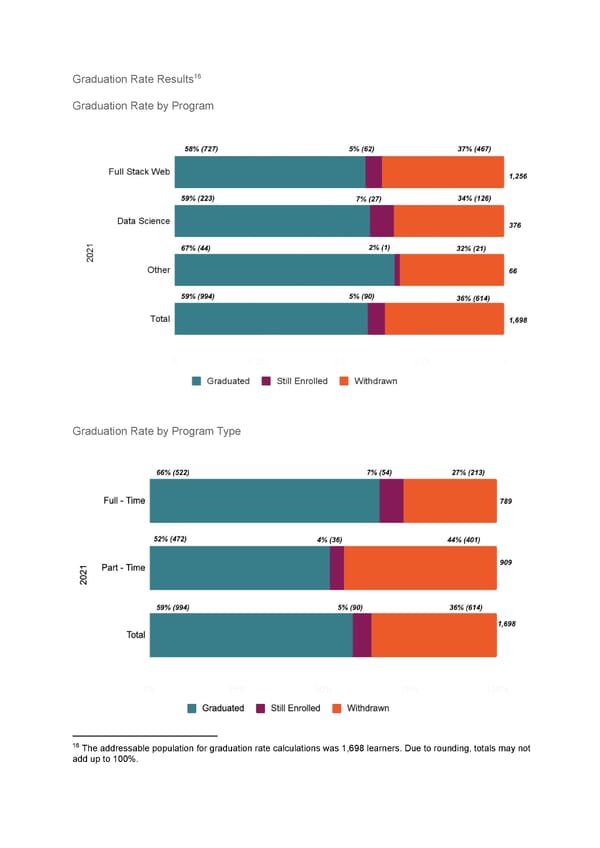
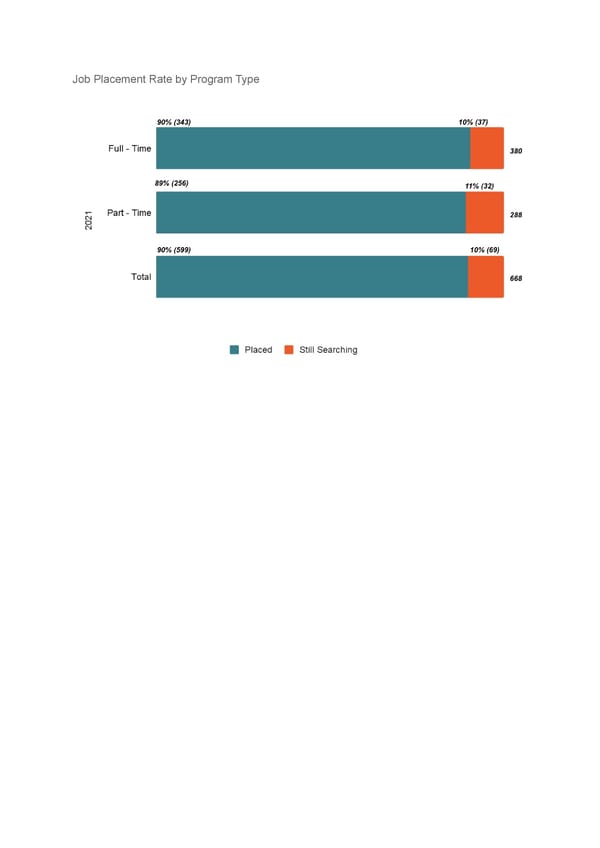
17 Job Placement Rate Our 2021 job placement rates provide evidence to support a fundamental belief at BloomTech: We provide a direct path to a well-paying job. When learners and graduates followed our training and job search program, the vast majority found a job. What’s more, is that we provided support throughout their education and beyond. Our career support throughout their program and after graduation meant they could lean on our expertise for best practices that lead to a job. Job Placement Rate Methodology Our Job Placement Rate is calculated from the population of Starting Learners whose Actual Graduation Date was during 2021. The addressable population of Starting Learners with an Original Expected Graduation Date in 2021 (1,698 learners) consists of three unique groups: ● Learners who graduated (994 learners) ● Learners who withdrew (614 learners) ● Learners who are still enrolled (90 learners) The 994 Starting Learners who graduated fall into one of three unique groups: ● Learners who graduated in 2021 (877 learners) ● Learners who graduated before 2021 (32 learners) ● Learners who graduated after 2021 (85 learners) The 877 Starting Learners with both an Original Expected Graduation Date and Actual Graduation Date in 2021 fall into one of two unique groups: ● Job Seeking Learners (550 learners) 18 ● Non-Job Seeking Learners (327 learners) Of these two groups, only Job Seeking Learners fall within the Job Placement Rate Addressable Population. The 550 Job Seeking Learners were then adjusted for an additional 128 Job Seeking Learners and 10 Unpaid/Unverified learners. These additional 128 learners had an Original Expected Graduation Date before or after 2021 and an Actual Graduation Date in 2021. Out of this total we removed these 10 learners who graduated in 2021 and got placed but we have not been able to verify their job or they received an unpaid job. 17 Management’s criterion for defining Job Placement Rate is the percentage of learners whose Actual Graduation Date was during 2021 that have secured a job placement, as of the Reporting Date. 18 A BloomTech graduate who has been unresponsive to outreach, has explicitly indicated they are not pursuing a technical role, or has explicitly indicated they have paused their job search.
The Job Placement Rate Addressable Population (668 learners) is composed of the following groups: ● Learners who graduated in 2021, had an Original Expected Graduation Date in 2021, and are Job Seeking (550 learners) ● Learners who graduated in 2021, had an Original Expected Graduation Date before 2021, and are Job Seeking (124 learners) ● Learners who graduated in 2021, had an Original Expected Graduation Date after 2021, and are Job Seeking (4 learners) 19 ● Removing unverified/unpaid learners who graduated in 2021 (10 learners) Job Placement Rate Addressable Population The addressable population for the Job Placement Rate is 668 learners with an Actual Graduation Date in 2021 and who were Job Seeking. 19 Learners who graduated in 2021 got placed but we have not been able to verify their job or they received an unpaid job
20 Job Placement Rate Results 21 Job Placement Rate by Program 20 Of 668 learners with an Actual Graduation Date in 2021 and who were Job Seeking, 599 received a job offer as of the reporting date 21 The addressable population for job placement rate calculations was 668 learners.
Job Placement Rate by Program Type
22 Time to Placement We also measure how long it takes our graduates to land jobs. When graduates are hired, they get to begin a rewarding career, and employers can fill openings needed to serve clients and grow their business. We are incredibly proud of our instructors, career support team, and entire staff for enabling learners to find jobs. Time to Placement Methodology Time to Placement is calculated for the population of learners who were placed in jobs as of the Reporting Date. Time to Placement represents the number of days from a learner’s Actual Graduation Date to Job Placement. Time to Placement is reported in 3 categories: ● % placed as of 90 days from Actual Graduation Date ● % placed as of 180 Days from Actual Graduation Date (includes % placed as of 90 days) ● % placed as of Reporting Date (includes % placed as of 90 days, and as of 180 days) Time to Placement Addressable Population 23 The addressable population for Time to Placement is 599 Placed Learners with an Actual Graduation Date in 2021 and who were Job Seeking. 22 Management’s criterion for defining Time to Placement is determined from how many Placed learners received job offer within X days of graduation 23 A learner whose Actual Graduation Date was in 2021 and who was subsequently placed in a job as of the Reporting Date August 11, 2022
24 Time to Placement Results 25 Time to Placement by Program Full Stack Web Data Science Other Total 57% (252) 48% (64) 52% (12) 55% (328) Within 90 days 84% (372) 81% (108) 87% (20) 83% (500) Within 180 days 100% (443) 100% (133) 100% (23) 100% (599) All Time 26 Time to Placement by Program Type Full-Time Part-Time Total 55% (188) 55% (140) 55% (328) Within 90 days 84% (289) 82% (211) 83% (500) Within 180 days 100% (343) 100% (256) 100% (599) All Time 24 The addressable population for time to placement calculations was 599 Placed Learners 25 Time to Placement Results are shown cumulatively within a given column. Each row is a subset of the following rows, so columns will not add up to 100%. For example, every placed learner who is counted in “within 90 days” is also included in “within 180 days.” 26 Time to Placement Results are shown cumulatively within a given column. Each row is a subset of the following rows, so columns will not add up to 100%. For example, every placed learner who is counted in “within 90 days” is also included in “within 180 days.”
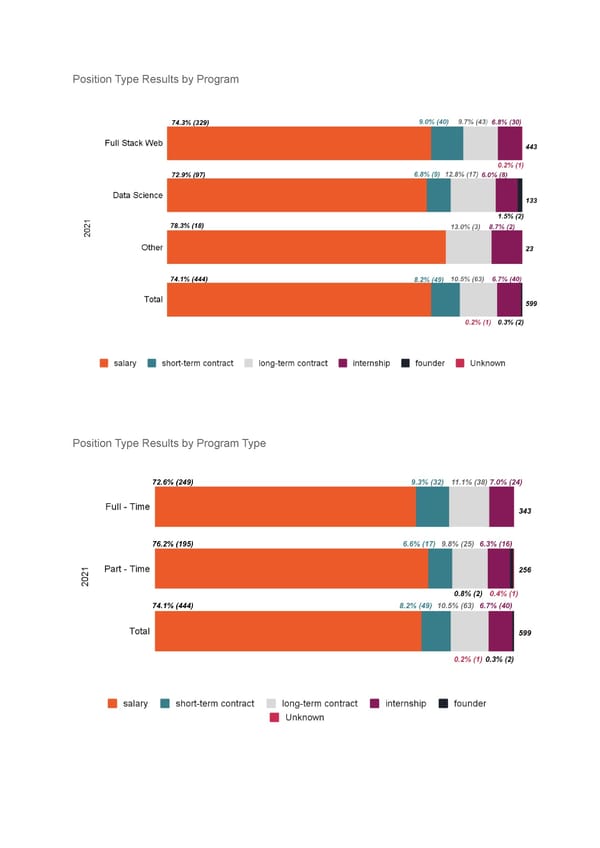
27 Position Type Tech hiring was strong in 2021, with a more secure economic outlook than in 2020. Long-term changes related to pandemic realities, such as the shift to doing more online, also increased 28 demand for workers skilled in creating, navigating, and collaborating in online environments . These economic factors may contribute to the greater proportion of BloomTech graduates working in salaried positions. We also believe that preparing learners for highly competitive in-demand roles led to more salaried offers. 29 Position Type Results 27 Management’s criterion for defining Position Type is determined from the position type of a learner's first Recorded Offer Recorded Offer: The job offer the learner self-reported to BloomTech or our ISA servicers 28 Source: https://www.prnewswire.com/news-releases/us-adds-tech-jobs-new-businesses 29 The addressable population for position type calculations was 599 Placed Learners with an Actual Graduation Date in 2021 and who were Job Seeking.
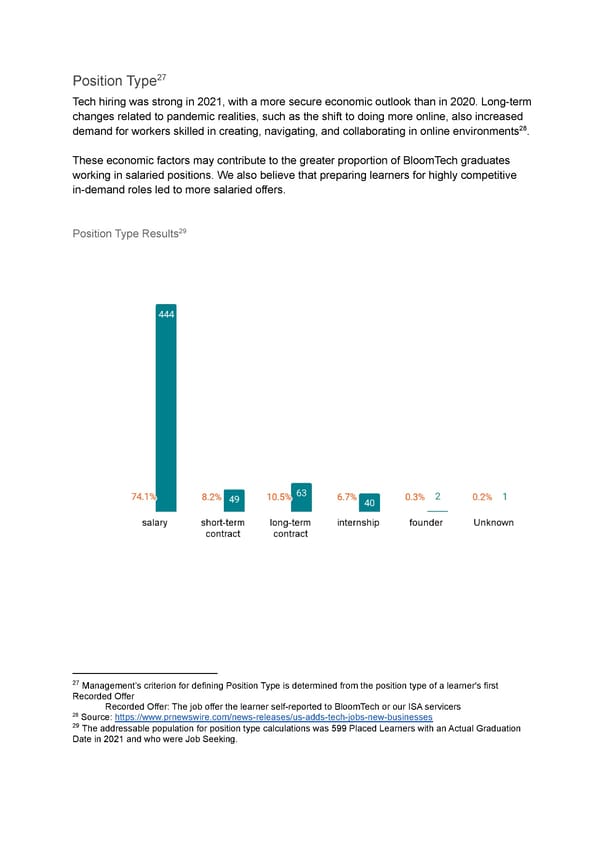
Position Type Results by Program Position Type Results by Program Type
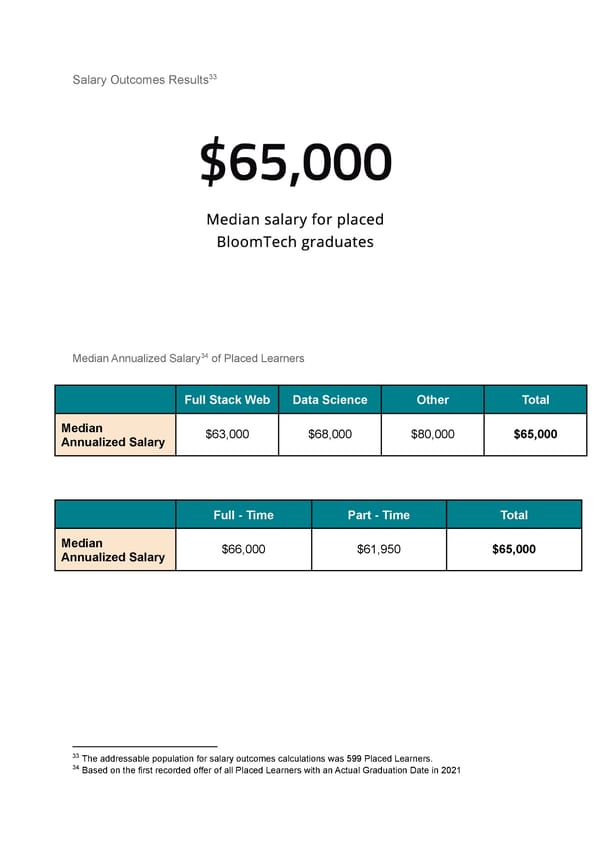
30 Salary Outcomes We are proud that our placed graduates are starting out with a median income of $65,000. In 31 contrast, the average college graduate earns a $55,260 starting salary —and this is after 4+ years of studying. Salary Outcomes reports on the salary for Placed Learners This analysis includes full-time salaried positions, as well as other types of work including long-term contracts, short-term contracts, and internship positions. Salaries for non-full-time 32 roles have been annualized . This analysis includes U.S.-based and internationally based positions. All salaries are reported in U.S. dollars; any offer reported in international currencies has been converted to U.S. dollars based on the market exchange rate at the time the offer was reported. Salary Outcomes Addressable Population Of the 668 Starting Learners who had an Actual Graduation Date in 2021 and were Job Seeking, 599 of these learners were subsequently Placed in jobs. The addressable population for Salary Outcomes is the 599 Placed Learners. Placed learners whose Salary Outcomes were not reported, are reported below as Unknown. 30 Management’s criterion for defining Salary Outcomes is determined from using the first Recorded Offer salary in USD (converted to USD for non-US salaries). Jobs that are not paid via annual salary (e.g., hourly consultants, part-time, etc.) are annualized. 31 Source: https://www.thinkimpact.com/average-college-graduate-salaries/ 32 BloomTech uses a standardized methodology to annualize all first placement offers. - Any offers in foreign currencies have been converted to US Dollars at the market exchange rate on the date BloomTech received offer information - Unless otherwise stated explicitly in the offer, BloomTech assumes 40 hours per work week and 52 weeks per work year. - For example, an offer for a non-full-time contract role at $20/hour is annualized as $20/hour * 40 hours/week * 52 weeks/year = $41,600
33 Salary Outcomes Results 34 Median Annualized Salary of Placed Learners Full Stack Web Data Science Other Total Median $63,000 $68,000 $80,000 $65,000 Annualized Salary Full - Time Part - Time Total Median $66,000 $61,950 $65,000 Annualized Salary 33 The addressable population for salary outcomes calculations was 599 Placed Learners. 34 Based on the first recorded offer of all Placed Learners with an Actual Graduation Date in 2021
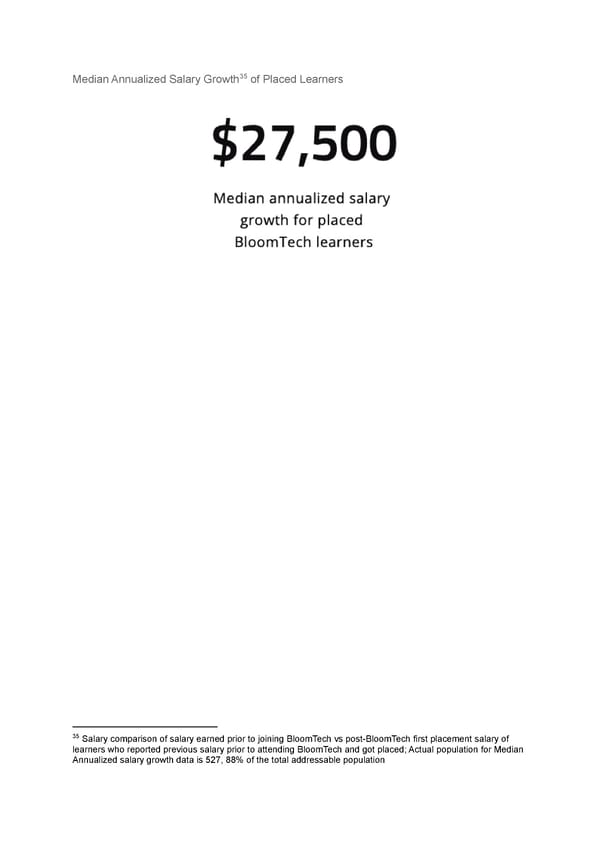
35 Median Annualized Salary Growth of Placed Learners 35 Salary comparison of salary earned prior to joining BloomTech vs post-BloomTech first placement salary of learners who reported previous salary prior to attending BloomTech and got placed; Actual population for Median Annualized salary growth data is 527, 88% of the total addressable population
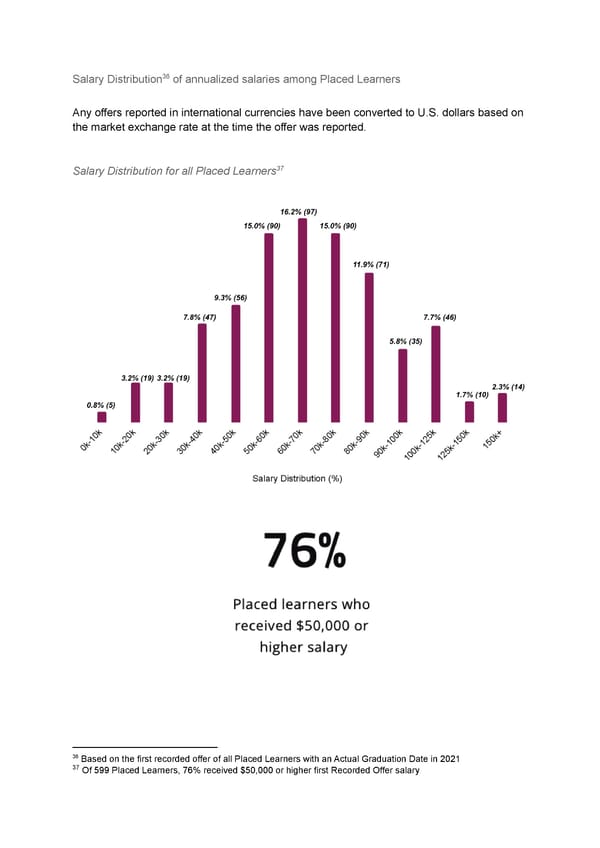
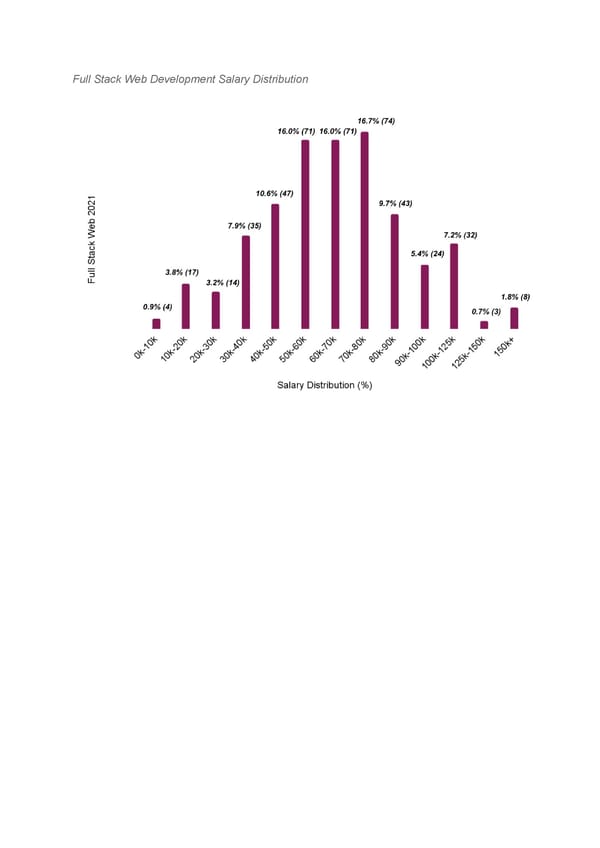
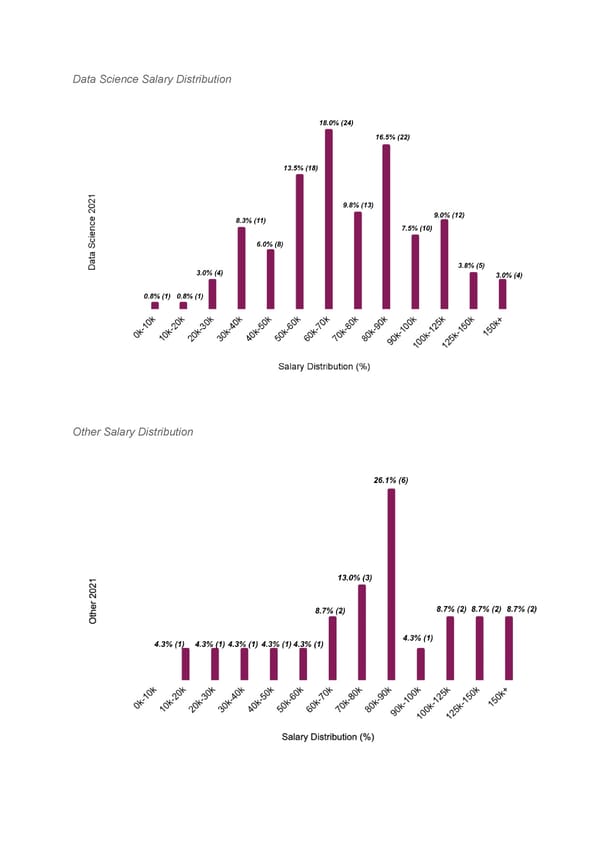
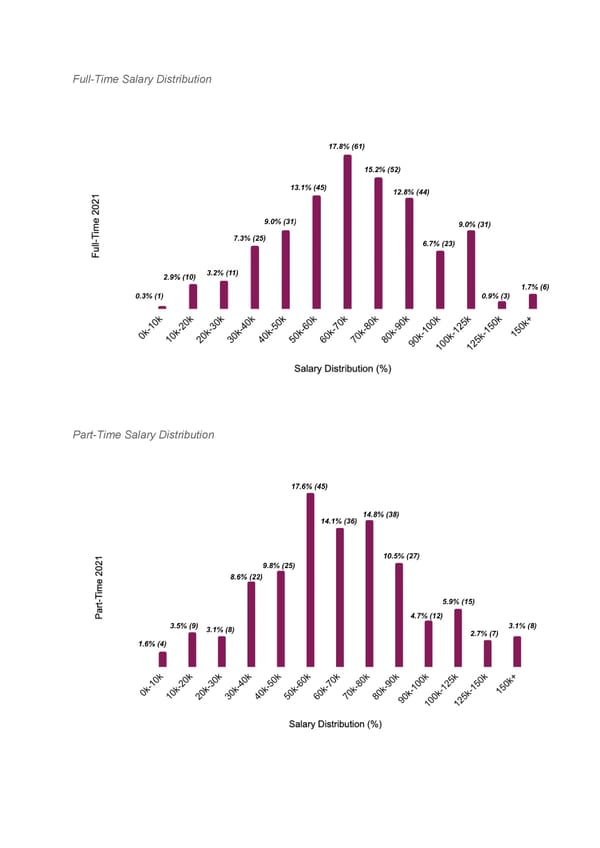
36 Salary Distribution of annualized salaries among Placed Learners Any offers reported in international currencies have been converted to U.S. dollars based on the market exchange rate at the time the offer was reported. 37 Salary Distribution for all Placed Learners 36 Based on the first recorded offer of all Placed Learners with an Actual Graduation Date in 2021 37 Of 599 Placed Learners, 76% received $50,000 or higher first Recorded Offer salary
Full Stack Web Development Salary Distribution
Data Science Salary Distribution Other Salary Distribution
Full-Time Salary Distribution Part-Time Salary Distribution
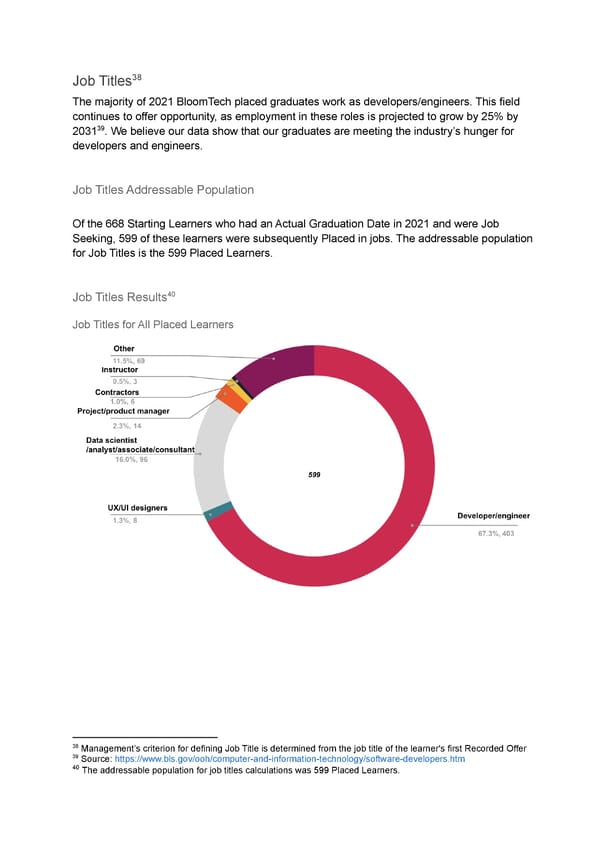
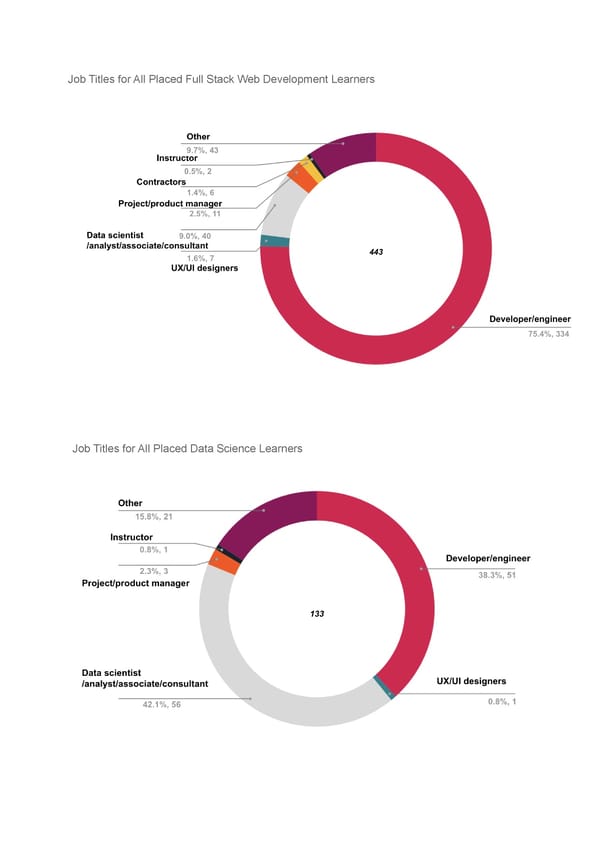
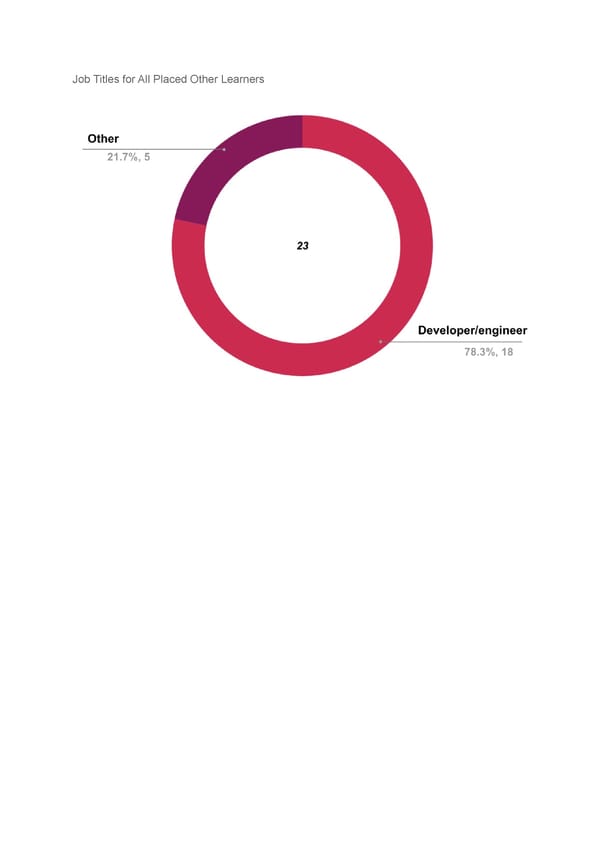
38 Job Titles The majority of 2021 BloomTech placed graduates work as developers/engineers. This field continues to offer opportunity, as employment in these roles is projected to grow by 25% by 39 2031 . We believe our data show that our graduates are meeting the industry’s hunger for developers and engineers. Job Titles Addressable Population Of the 668 Starting Learners who had an Actual Graduation Date in 2021 and were Job Seeking, 599 of these learners were subsequently Placed in jobs. The addressable population for Job Titles is the 599 Placed Learners. 40 Job Titles Results Job Titles for All Placed Learners 38 Management’s criterion for defining Job Title is determined from the job title of the learner's first Recorded Offer 39 Source: https://www.bls.gov/ooh/computer-and-information-technology/software-developers.htm 40 The addressable population for job titles calculations was 599 Placed Learners.
Job Titles for All Placed Full Stack Web Development Learners Job Titles for All Placed Data Science Learners
Job Titles for All Placed Other Learners
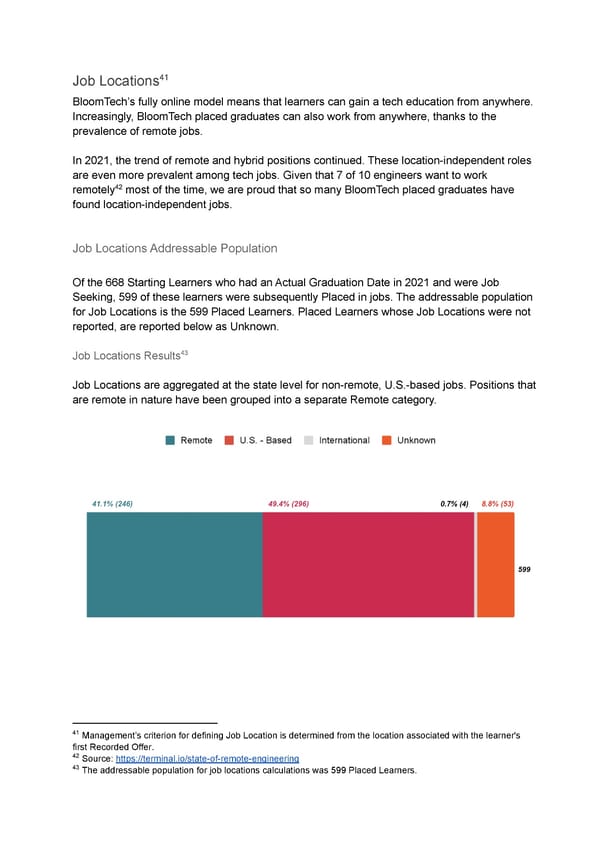
41 Job Locations BloomTech’s fully online model means that learners can gain a tech education from anywhere. Increasingly, BloomTech placed graduates can also work from anywhere, thanks to the prevalence of remote jobs. In 2021, the trend of remote and hybrid positions continued. These location-independent roles are even more prevalent among tech jobs. Given that 7 of 10 engineers want to work 42 remotely most of the time, we are proud that so many BloomTech placed graduates have found location-independent jobs. Job Locations Addressable Population Of the 668 Starting Learners who had an Actual Graduation Date in 2021 and were Job Seeking, 599 of these learners were subsequently Placed in jobs. The addressable population for Job Locations is the 599 Placed Learners. Placed Learners whose Job Locations were not reported, are reported below as Unknown. 43 Job Locations Results Job Locations are aggregated at the state level for non-remote, U.S.-based jobs. Positions that are remote in nature have been grouped into a separate Remote category. 41 Management’s criterion for defining Job Location is determined from the location associated with the learner's first Recorded Offer. 42 Source: https://terminal.io/state-of-remote-engineering 43 The addressable population for job locations calculations was 599 Placed Learners.
Job Placements by State Austen Allred, CEO
44 A selection of companies that hired multiple BloomTech graduates 44 All companies included here hired at least 2 BloomTech graduates in either long-term or salaried roles

